
Community structure
Identifying what factors and processes (both ecological and evolutionary) drive patterns of community assembly and structure is fundamental to test hypotheses on patterns of species coexistence and maintenance of biodiversity. Such an objective is also critical for understanding mechanisms driving species extinctions, especially given the current extinction crisis. We are particularly interested in questions elucidating whether competition, facilitation, environmental filtering, neutral processes, or a combination of these processes determine the structure of ecological communities. We sought to address this aim by focusing on mammal, bird and plant communities in Madagascar’s tropical systems as model systems.
Previous work on this topic:
Previous work on this topic:
- Identifying the importance of animal-mediated seed dispersal in structuring plant communities. More details here.
- Razafindratsima et al. (2013) showed that past Holocene extinction events resulted in structural changes in the phenotypic, but not in the phylogenetic, patterns of diversity in lemur communities across Madagascar. In addition, environmental filtering may be important in structuring present-day lemur communities because lower divergence in patterns of phylogeny, body mass and activity rhythms were found in dry relative to wet habitats.
- Using a macroecological approach, Park and Razafindratsima (2018) showed that plant community diversity can have significant influences on the taxonomic, phylogenetic and functional diversity of mammals and birds. In addition, the data suggest that plant and animal communities could become more clustered in the future, in terms of both phylogenetic and functional diversity, if current species extinctions and biological invasions continue, leading to homogenization of the flora and fauna.
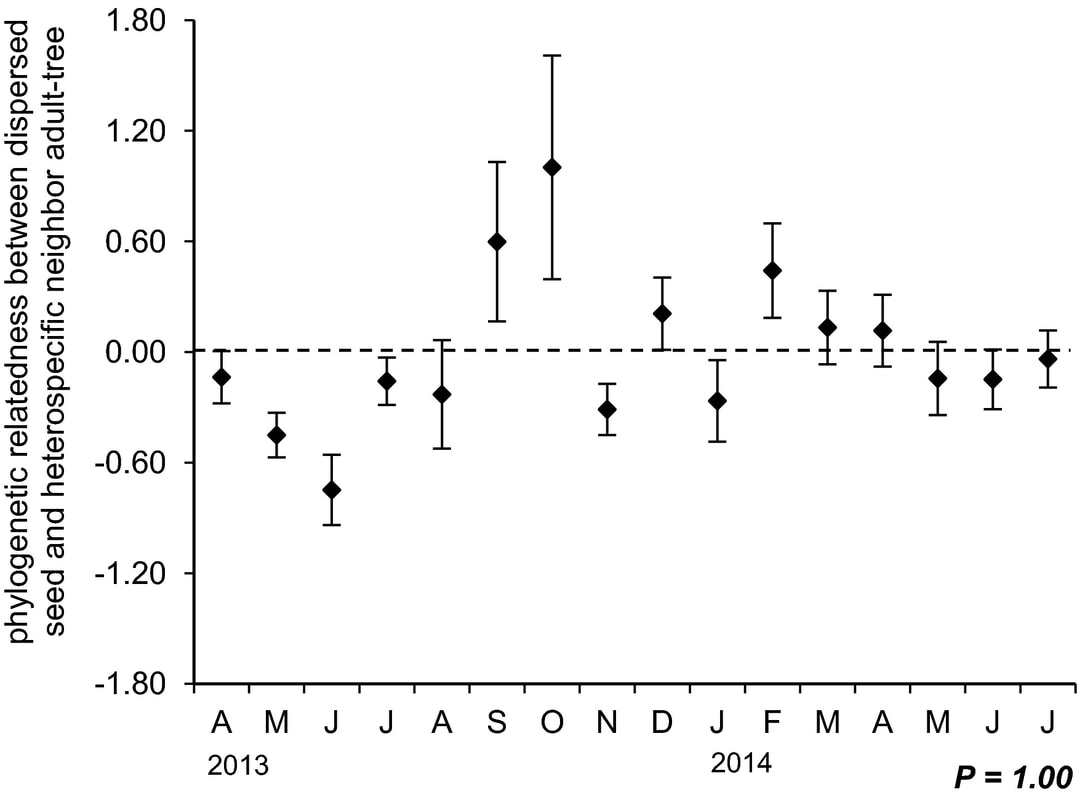
|
Phylogenetic relationships (NRI) between dispersed seeds and their nearest adult neighbor trees, using our seed trap data, fluctuate across months (April 2013–July 2014). Values <0 indicate that the species pairs are less closely related than expected by chance; >0 suggest that they are more closely related than expected by chance, and values near zero indicate a random relatedness. P‐values correspond to runs test used to assess whether the distribution of NRI values over time is random.
Ecology, Volume: 97, Issue: 8, Pages: 2094-2102, First published: 10 April 2016, DOI: (10.1002/ecy.1434) |
